


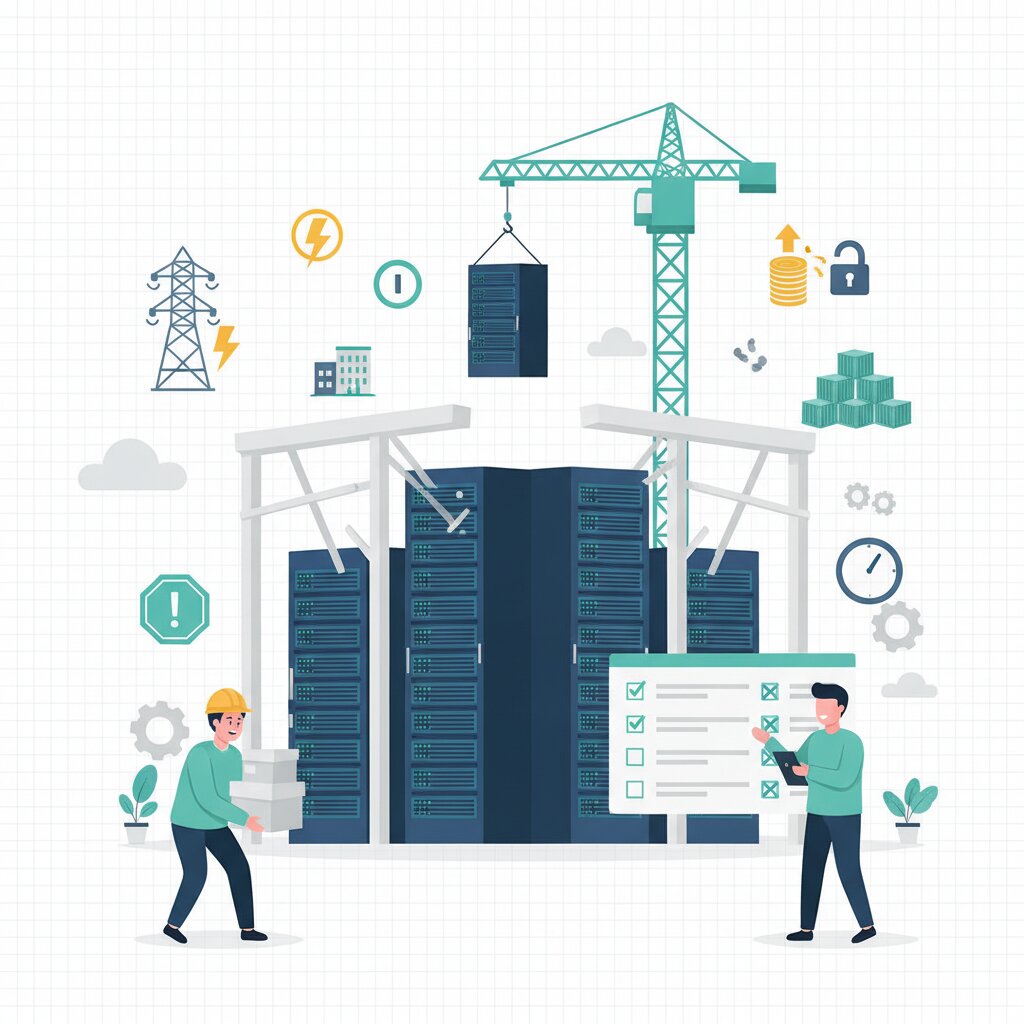

Alphabet, Amazon, Meta and Microsoft have committed roughly $650 billion to AI data centre builds for 2026 alone. The interesting part is what it is running into. 30 to 50% of the US data centre capacity planned for 2026 is on track to be delayed or cancelled, and the blockers are power grids, electrical equipment, skilled tradespeople, local communities and memory chips.
Collateral damage here means the costs the boom is pushing onto everything around it: the schedules, neighbourhoods, device prices and budgets caught in the fallout.
The damage shows up along four fault lines.
- Capacity and power. Planned capacity keeps slipping because the grid connection is now the long pole in the schedule, ahead of the building itself.
- The construction squeeze. Equipment waits measured in years, a skilled-trade shortage, and organised theft.
- Pushback. Communities and governments are pushing back, from gas-turbine litigation to moratorium legislation in US states.
- Price fallout. Memory costs have roughly doubled, and the shock has reached consumer devices and cloud bills.
This page keeps things at overview depth. The four articles carry the evidence, the trade-offs and the evaluation criteria.
Why does this matter now? Every thread lands in a real decision your business will face: where to put workloads, which vendors to trust, when to refresh, what terms to sign. Australian cloud regions and hardware pricing track the same global supply chains. The buildout is buckling under the physical, human, political and supply-chain systems it outran.
In this series:
- Why so much US AI data centre capacity is delayed or cancelled: the grid and interconnection backlog.
- How equipment, labour and theft are holding back AI data centre construction: transformer lead times, the skilled-labour gap, and cargo crime.
- Why AI data centres are facing moratoriums and lawsuits: BYOP power strategies and the legislative pushback.
- Why AI is driving up RAM prices and squeezing tech budgets: how AI’s memory appetite reaches your budget.
Why is record investment not translating into energised AI data centre capacity?
30 to 50% of the US data centre capacity planned for 2026 is slipping or being cancelled, and the reason sits in the physical and regulatory systems that energise a building. A shell goes up in 12 to 18 months, but grid connection averages four years and stretches past seven in Northern Virginia. If you are planning or buying capacity, expect scarcity, longer commitments and higher prices.
Demand-side signals are still strong: GPU demand, deep cloud backlogs, rising capex. The shortfall is physical and regulatory. You cannot negotiate with a substation.
Where does the time go? A data centre has two timelines. The shell is fast. Energisation is slow: permitting and approvals, interconnection studies, equipment procurement. More than 2,000 GW of projects sit in US interconnection queues.
Capacity tightness feeds pricing and contract terms downstream, and where capacity lands determines your region options.
The full picture is in why so much US AI data centre capacity is delayed or cancelled.
What is holding up AI data centre construction beyond grid connections?
Even with a grid connection secured, energisation stalls on hardware and people. Substation transformer lead times have passed 160 weeks in the US. Skilled trades are scarce enough to count as the industry’s second bottleneck, and organised cargo theft added roughly $725 million in losses in 2025, up about 60%. The question to ask of any schedule or vendor is whether they carry these risks.
The equipment gate exists because the gear is bespoke and slow to make. Transformers, switchgear and high-voltage cable are built to order on long manufacturing cycles, and two decades of flat grid investment left factories sized for a smaller market.
People and crime stretch schedules too. Training pipelines for electricians take years, so capital alone cannot buy speed. Organised theft feeds on the boom, and each stolen shipment joins the same scarce equipment queues, making the shortage worse.
Can modular construction save the schedule? The honest 2026 position is faster in the right scope, contested on cost. Prefabricated power skids and data halls compress on-site timelines, but a power skid still needs the same transformers and switchgear everyone else is queued for.
The bottlenecks, the crime mechanics and the modular verdict are in the equipment, labour and theft crunch in data centre construction.
Why are communities and governments pushing back on AI data centres?
The boom’s physical footprint (noise, emissions, water use and ratepayer cost shifts) has converted local grievances into systemic delivery risk. Developers responded with “bring your own power” to skip grid queues, and that workaround triggered its own backlash: a class action in Memphis and moratorium legislation spreading across US states. Siting risk is now a project variable you should price in.
BYOP exists because the grid queue problem described above makes waiting unviable: if a connection takes four to seven years, generating your own power on site is the workaround. The trade-off is one line: speed versus permits, emissions, noise and community consent.
A class action over xAI‘s gas turbines alleges the noise makes homes hard to live in and sell, and Starlink’s answer, 50% discounts for neighbours, was read by critics as “hush money“.
The policy response is now structural. Eleven US states have introduced moratorium legislation. The takeaway for your business: a siting-risk premium, jurisdictions competing on power and water headroom, and legislation as a leading indicator.
The full mechanics, the case study and what to watch are in the moratoriums, lawsuits and BYOP backlash.
How does the AI buildout reach your tech budgets, from RAM to cloud bills?
The same boom is repricing the technology you buy. AI data centres are on track to consume about 70% of global memory chip output, and hyperscale buying has roughly doubled AI-server memory costs in a single quarter. That squeeze has reached MacBooks, consoles and phones, reversing decades of falling electronics prices. Your budget planning needs three exposure factors: memory-heavy workloads, renewal timing and region choice.
The term to know is “RAMageddon”: the AI-driven memory price surge. The mechanism: Samsung, SK Hynix and Micron are reallocating wafer capacity from commodity DRAM toward HBM and high-capacity DDR5 for AI servers. The same shortage is wearing different price tags in every category.
Supercycle or bust? Both cases are real. The bull case is a supercycle: structural AI demand, with undersupply modelled through 2027. The bear case is memory’s cyclical history and new capacity landing from 2027. The decision-support point: plan for both scenarios rather than betting on a single forecast.
What it means for you: cloud and AI service costs are directionally up for memory- and GPU-heavy workloads in constrained regions. Hardware refresh timing and contract terms matter more, and multi-year cloud commitments are better placed than on-demand buying. Region choice and a provider’s power runway are the levers to check.
Where the price pressure originates and which budgets it hits first is in what the crunch means for memory prices and tech budgets.
Where to start:
- Planning compute capacity, cloud regions or grid strategy: Why so much US AI data centre capacity is delayed or cancelled.
- Buying hardware, building facilities or managing infrastructure procurement: How equipment, labour and theft are holding back AI data centre construction.
- Making siting decisions, or managing community and regulatory exposure: Why AI data centres are facing moratoriums and lawsuits.
- Budgeting, negotiating vendor contracts or planning device refresh cycles: Why AI is driving up RAM prices and squeezing tech budgets.
Frequently Asked Questions
Is the AI boom actually slowing down?
No. Demand and spending keep climbing; what is stalling is the physical build, not the commercial case. The six largest US hyperscalers are on track for about $500 billion of capital spending in 2026 and $600 billion in 2027, per Moody’s, and cloud backlogs remain deep. So treat the delays as a delivery problem, not a demand signal.
How long will this bottleneck last?
No one can set a firm date, but the planning assumption should be years rather than quarters. Grid queues run four to seven years, transformer lead times have passed 160 weeks, and new memory capacity does not land until 2027 at the earliest. Watch interconnection reform and equipment factory expansions for the first signs of relief.
Is this a US problem, or will Australian teams feel it too?

The constraints are US-led, but the effects travel. Memory and hardware pricing are set in global supply chains, so Australian budgets face the same device and cloud cost pressure, and local capacity competes for the same vendors and equipment. The National Electricity Market is also heading down the same demand curve, with data centres moving from about 2% of supply today toward 6% by 2030.
What is “time to power”, and why does it decide where my workloads can run?
Time to power is the gap between deciding you need data centre capacity and having utility power delivered. The building is the fast part, 12 to 18 months, while grid connection averages four years and stretches past seven in Northern Virginia. Because energisation, not construction, gates availability, it shapes where capacity exists, when you can buy it and what you pay.
Why don’t better chips and efficiency fixes solve the power problem?
They help per unit of work, but total demand keeps outrunning the savings, a pattern called the Jevons paradox. Google cut data centre emissions 12% in 2024 while its absolute electricity consumption grew 27%, and rack densities are heading past 100 kW. The IEA expects global data centre electricity use to roughly double by 2030, so efficiency changes the slope, not the direction.
Will AI data centres push up household power bills or cause blackouts?
The real pressure point is who pays for grid upgrades, not street-level blackouts. Several US states now require large energy users to sit in dedicated billing classes so those costs sit with the load that drives them, and CEFC modelling projects Australian wholesale prices lifting 26% in NSW and 23% in Victoria by 2035 if supply does not keep pace.
Can nuclear restarts or small modular reactors fix capacity in time?
Not on the timeline this boom needs. Nuclear restarts and small modular reactors are long-horizon plays: Microsoft’s Three Mile Island agreement with Constellation Energy and the SMR bets from Google and Amazon are not capacity that arrives in 2026. The current workaround is on-site gas generation, and those turbines are sold out too, with some suppliers booked through 2028.
Do data centre moratoriums actually stop builds, or just move them?
They mostly redirect the pressure rather than stop it. New York’s statewide pause shows how quickly permitting can tighten, and Ireland lifted its connection freeze by requiring new data centres to bring their own power. The practical effect is a siting-risk premium and jurisdictions competing on power and water headroom. Watch legislation as a leading indicator of where builds can go.
What happens if my cloud provider’s new capacity slips?
Existing service is usually the last thing to be cut, so the risk shows up in expansions, new regions and renewal pricing, where scarcity gets passed through. Before you commit, check whether the capacity is energised or announced, ask about the provider’s power runway, and treat delivery dates as claims to verify rather than facts.
Should we pull our hardware refresh forward before memory prices rise again?
For memory-heavy systems, moving a planned refresh forward is the lower-risk option if the cycle is already close. DRAM contract prices rose about 171% year over year by late 2025, PC makers are signalling 15 to 20% increases, and TrendForce expects mainstream laptop prices to rise as much as 40% in 2026.
How should we vet a vendor’s delivery promises before signing?
Treat the energisation path as the thing to verify. Ask where the power comes from, whether the site is grid-queued or behind-the-meter, what transformer and switchgear lead times sit in the schedule, and who carries the cost if the date slips. Modular savings claims warrant scrutiny, because the cost studies are thin and often vendor-published.
How much of the alarm is hype, and which claims should we trust?
The core claims hold up better than the noise suggests; the edges are estimates. Schedule slippage, seven-year energisation timelines, transformer lead times beyond 160 weeks and the memory price moves come from grid operators, analysts and pricing trackers. The 30 to 50% slippage range, modular savings and long-range forecasts are softer, so treat them as scenarios to plan around, not facts to bet on.