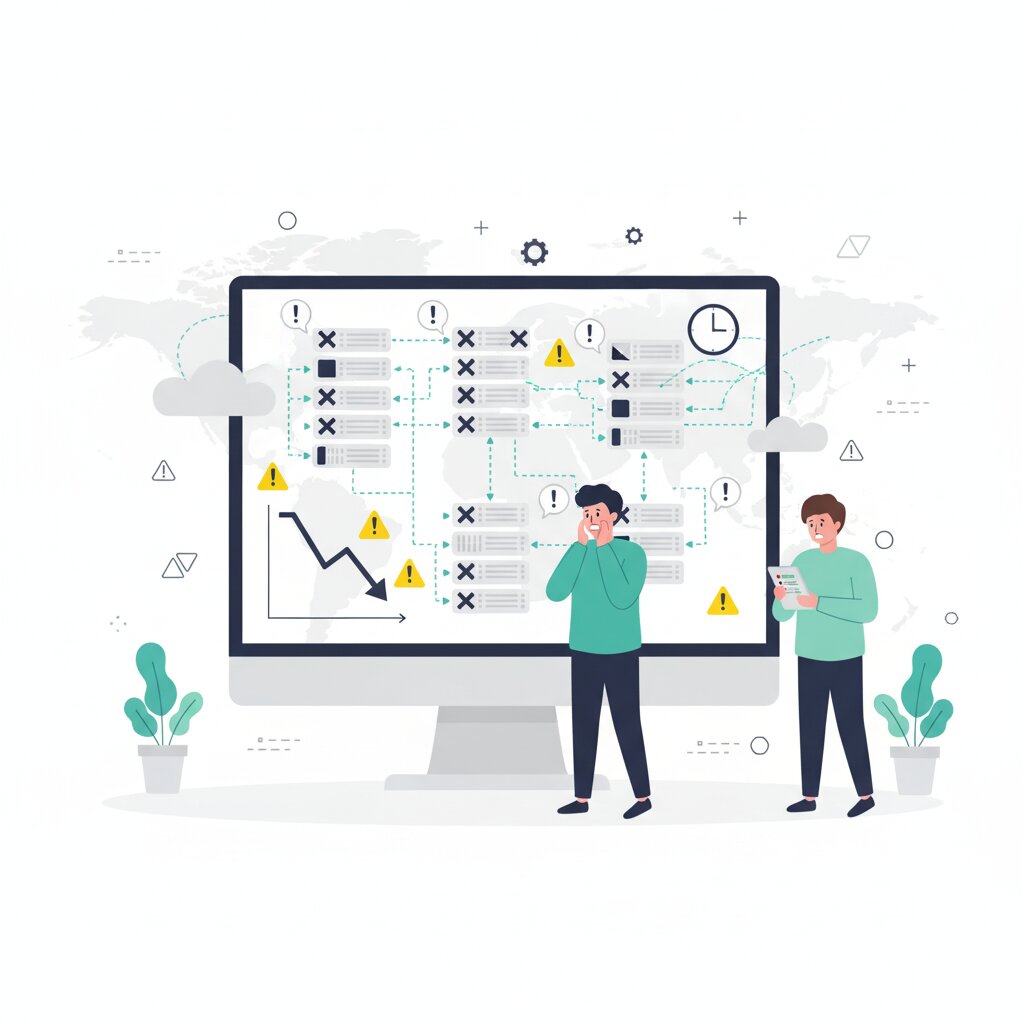

Cloudflare and AWS both had major outages in late 2025. Businesses worldwide felt it. Traditional monitoring and reactive incident response didn’t save them.
Your cloud provider’s SLA looks solid on paper. But recent incidents show they offer minimal compensation—10% credits—relative to actual business impact. Cloudflare’s December outage cost affected businesses $250-300M in losses. AWS credits don’t come close to covering that kind of damage.
There’s a better approach. Chaos engineering combined with observability lets you identify and eliminate single points of failure before they cause outages. You can reduce MTTR by 60-80%, discover hidden failure modes in controlled conditions, and build confidence in system resilience.
This guide builds on the operational resilience overview to show you how chaos engineering and observability work together to build architectures that survive infrastructure failures.
What is chaos engineering and how does it improve operational resilience?
Chaos engineering is deliberately injecting failures into your infrastructure to identify weaknesses before they cause actual customer-facing outages. You break things on purpose so customers don’t experience the breakage first.
Netflix pioneered this with Chaos Monkey, which randomly terminated production instances to validate their resilience. The core principle is simple: proactively discover failure modes rather than waiting for them to occur.
Modern chaos engineering goes well beyond random instance termination. You can inject network latency, trigger resource exhaustion, introduce configuration errors, and simulate dependency failures. It’s different from traditional testing because you operate in production or production-like environments with real traffic patterns.
The key benefit? Converting unknown failure scenarios into known scenarios. Unknown failures require investigation and debugging under pressure. Known failures can be automated in runbooks, which means teams can execute documented procedures instead of investigating from scratch.
Testing incrementally is how you do it safely. Start with single-pod failures before scaling to node or region-level failures. Run regular game days involving technical teams, support, and business stakeholders to practice response procedures.
How does observability differ from traditional monitoring?
Chaos engineering alone isn’t enough. To understand what breaks during controlled failures, you need comprehensive observability.
Observability lets you understand a system’s internal state by examining its external outputs—metrics, logs, and traces. The difference from traditional monitoring is straightforward: monitoring tracks known failure conditions, observability lets you debug unexpected problems you’ve never seen before.
Traditional monitoring checks predefined metrics against thresholds. CPU above 80%, disk space below 10%, specific error rates. You set alerts for things you already know can go wrong.
Observability explores system behaviour through high-cardinality data, distributed tracing, and event-driven debugging. The three pillars are metrics (what is broken), logs (why it’s broken), and traces (where it’s broken in distributed systems).
You can’t run chaos experiments effectively without observability. You need it to understand what happens when you inject failures.
Modern observability platforms let you answer questions like “why did latency increase for users in Asia but not Europe during that deployment?” Datadog, Honeycomb, and New Relic provide unified views across multi-cloud environments, which helps when you’re trying to figure out whether an issue sits with your application or your cloud provider.
What are single points of failure in cloud architecture and how do you identify them?
A single point of failure is any component whose failure causes an entire system or service to become unavailable. In cloud environments, these include single-region deployments, reliance on one CDN provider, DNS dependencies, and specific services like AWS US-East-1.
Common cloud SPOFs are easier to identify than hidden ones. The obvious candidates: entire cloud provider, specific region, database instance, DNS resolver, load balancer, configuration management system.
Hidden SPOFs cause more problems. Third-party APIs, authentication providers, payment gateways, logging infrastructure, and monitoring systems themselves. When your monitoring system depends on the same infrastructure it monitors, you have a problem.
A configuration change to Cloudflare’s global Web Application Firewall took down 28% of HTTP traffic. The change aimed to protect React Server Components against a security vulnerability but created a new failure mode instead. This illustrates the type of Cloudflare configuration mistakes that chaos engineering helps you discover before they affect production.
AWS had its own problems in October 2025. A DNS resolution issue for DynamoDB service endpoints within AWS’s internal network triggered cascading failures across EC2, Lambda, CloudWatch, and dozens of other services. US-EAST-1 hosts an estimated 30-40% of global AWS workloads, making this concentrated dependency particularly dangerous. Understanding these lessons from AWS cascading failures informs how you design your own resilience testing.
Identifying SPOFs requires dependency mapping, chaos engineering experiments (deliberately fail each component), architecture reviews, and post-mortem analysis.
Different situations need different approaches to mitigation. Redundancy with active-passive failover provides baseline protection. Active-active architecture delivers higher resilience. The circuit breaker pattern enables graceful degradation when dependencies fail.
How do chaos engineering and observability work together?
Chaos engineering generates controlled failures while observability provides the visibility to understand system behaviour during those failures. You need both working together.
The integration workflow is straightforward. Design a chaos experiment, implement observability for experiment metrics, run the experiment in staging, analyse behaviour through observability tools, fix discovered issues, then repeat in production with gradual blast radius expansion.
Here’s a practical example. You inject 500ms latency into database calls (chaos) while monitoring request traces (observability) to identify timeout configurations, caching gaps, and retry logic bugs. Distributed tracing lets you follow requests as they flow through your system, pinpointing exactly where the injected latency causes problems.
Observability data feeds runbook creation. Once you understand a failure through chaos experiments, document recovery steps for incident responders.
Game days are scheduled exercises combining chaos experiments with incident response practice. You use observability to validate response effectiveness. Did your team detect the failure quickly? Did they identify the root cause? Did they execute the correct recovery procedure?
What is mean time to recovery (MTTR) and how do you reduce it?
Understanding MTTR is one thing. Implementing chaos engineering to improve it requires careful planning.
Mean time to recovery measures the average time from detecting a failure to restoring full service functionality. It’s the primary metric for evaluating operational resilience effectiveness. Industry leaders achieve MTTR under 15 minutes. Industry average sits at 2-4 hours.
MTTR has four components: detection time (how quickly you notice the problem), diagnosis time (identifying root cause), mitigation time (implementing fix), and recovery time (restoring normal operation).
Observability reduces detection and diagnosis time. Distributed tracing immediately shows failure location. High-cardinality queries enable rapid root cause analysis.
Chaos engineering reduces mitigation and recovery time. Teams practice responding to failures. Runbooks document recovery procedures. Automation eliminates manual steps.
The business impact is significant. Reducing MTTR from 4 hours to 30 minutes at 99.9% uptime saves approximately 35 hours of downtime annually. For a business processing $95 per minute in revenue, that’s $200K saved.
Track MTTR per incident category—database failures, network issues, deployment problems. This identifies improvement opportunities. You might discover database failovers take 2 hours while deployment rollbacks take 5 minutes, telling you exactly where to focus optimisation efforts.
Common MTTR pitfalls to avoid: measuring from mitigation start rather than failure occurrence, excluding weekends and holidays from calculations, not tracking detection delays. Industry targets for P0 incidents are under 4 hours, with first response under 15 minutes.
How do you implement chaos engineering in production environments safely?
Safe production chaos engineering starts small and expands gradually as confidence builds. Modern chaos platforms provide safety controls like automatic rollback, blast radius limits, and progressive experiment execution.
Phase 1 (weeks 1-4): Run chaos experiments in staging with synthetic traffic. Focus on well-understood failure modes like instance termination and network delays. Set up controlled environments for testing and monitor metrics closely.
Phase 2 (weeks 5-8): Move to production experiments during business hours with less than 1% traffic exposure. Maintain manual oversight with authority to halt the experiment immediately.
Phase 3 (weeks 9-12): Expand to 5-10% traffic. Automate safety controls with circuit breakers and automatic rollback when SLO violations occur.
Phase 4 (ongoing): Implement continuous chaos with Game Day exercises. Schedule automated chaos during low-traffic periods.
Blast radius constraints limit experiments to specific availability zones, services, or customer segments. Automatic shutdown triggers stop experiments when error rates exceed thresholds. Manual approval gates protect high-risk experiments.
Gremlin provides enterprise safety features and compliance reporting. Open-source Chaos Monkey works well for simpler AWS environments. Cloud-native chaos tools like AWS FIS and Azure Chaos Studio handle provider-specific experiments.
Require organisational readiness before chaos adoption. You need observability infrastructure before you start chaos engineering. Make sure on-call engineers understand experiments are running. Establish communication protocols for experiment incidents.
What observability capabilities are essential for operational resilience?
Observability capabilities you need include distributed tracing across microservices, high-cardinality metric analysis, real-time log aggregation, and correlation between these data sources. Multi-cloud environments require unified observability across providers to detect cross-provider issues.
Distributed tracing follows request paths through 10+ microservices to identify latency sources, visualise dependency graphs, and understand cascading failure patterns. When a request hits 15 services and takes 3 seconds to complete, you need to know which service consumed 2.8 seconds.
High-cardinality metrics let you query on dimensions like customer ID, region, and version to find issues affecting specific user segments. Aggregate metrics miss these patterns. You might have acceptable average latency but terrible latency for a specific customer segment.
Log aggregation centralises logs from containers, functions, and managed services to search across your entire infrastructure during incidents. When something breaks at 3am, you don’t want to check multiple log sources.
Real-time alerting triggers on anomalies and threshold breaches with context-aware notifications. Different alerts for staging versus production. Different handling for business hours versus off-hours.
Multi-cloud observability provides unified dashboards showing AWS, Azure, and GCP metrics together to detect provider-specific issues versus application issues. When latency increases, you need to know whether it’s your code or your cloud provider. This becomes essential when you implement multi-cloud operational complexity and need visibility across different providers.
The tool landscape offers several strong options. Datadog provides comprehensive multi-cloud coverage. Honeycomb excels at high-cardinality analysis. New Relic offers strong APM capabilities. Prometheus plus Grafana delivers a cost-conscious open-source approach.
How do you build effective incident response procedures?
Effective incident response combines documented runbooks, clear escalation paths, practiced communication protocols, and post-incident reviews that feed continuous improvement. The goal is reducing MTTR through preparation rather than reactive debugging during incidents.
Runbook components need four elements: detection criteria (what observability signals indicate this incident type), triage steps (how to confirm and assess severity), mitigation procedures (step-by-step recovery actions), and escalation triggers (when to engage additional teams or leadership).
Incident severity classification keeps everyone aligned. SEV1 means complete service outage, all hands on deck. SEV2 means major feature broken, affects revenue. SEV3 means minor degradation, can wait for business hours.
Communication protocols work alongside technical response. Status page updates, customer notifications, internal stakeholder briefings, post-incident summary. Only 30% of organisations regularly test their incident response plans, which explains why communication breaks down during actual incidents.
On-call best practices prevent burnout and improve response quality. Follow-the-sun rotation distributes load. Incident commander role stays separate from technical responders. Blameless post-mortems focus on system improvements, not individual mistakes.
The post-mortem process reconstructs timelines using observability data, conducts root cause analysis (five whys), identifies contributing factors, and assigns action items with owners and deadlines. Organisations that learn from past incidents reduce future incidents by up to 50%.
Measure incident response effectiveness through MTTR trends, percentage of incidents with existing runbooks, time from detection to first action, and action item completion rates from post-mortems.
What deployment practices prevent configuration-induced outages?
Remember the Cloudflare incident? Configuration changes without gradual rollout create single points of failure.
Progressive deployment strategies including canary releases, blue-green deployments, and feature flags limit blast radius and enable rapid rollback when configuration changes cause issues.
Canary deployment releases configuration to 1-5% of infrastructure first. Monitor error rates and latency for 30-60 minutes. Gradually expand to 25%, then 50%, then 100%. Roll back if anomalies appear.
Blue-green deployment maintains two identical production environments. Deploy changes to the idle environment. Switch traffic with instant rollback capability if issues appear.
Feature flags decouple deployment from release by deploying inactive features. Enable for a percentage of users. Disable immediately if issues are detected.
Configuration drift prevention ensures consistency. Infrastructure as Code using Terraform or CloudFormation ensures consistent configuration across regions. Version control tracks all changes. Automated validation catches errors before deployment.
Progressive rollout velocity should balance speed versus safety based on change risk. Cosmetic UI changes can roll out quickly. Authentication changes require gradual validation.
Blast radius limitation follows a simple pattern: deploy to single availability zone before multiple zones, one region before multi-region, internal services before customer-facing services. Understanding architecture requirements helps you design deployment strategies that align with your resilience patterns.
How do you justify chaos engineering and observability investments to leadership?
These sections address different audiences—technical teams versus leadership. Here’s how you make the business case.

Business justification centres on quantifying downtime costs, comparing SLA compensation to actual losses, and demonstrating MTTR improvements.
Downtime cost calculation is straightforward. Revenue per minute equals annual revenue divided by 525,600 minutes. Multiply by incident duration and affected traffic percentage.
Example calculation: A $50M annual revenue company generates $95 per minute baseline. A 4-hour complete outage costs $22,800 in direct revenue loss. Add brand damage, customer churn, and incident response costs—typically 3-5x direct loss—and you’re looking at $80K+ total impact.
SLA gap analysis shows the problem. AWS standard SLA offers 10% credit for uptime below 99.99%, 25% credit for uptime below 99.0%. If a $50,000 per month customer receives a 25% credit ($12,500) but experiences $150,000 in actual business losses, the SLA covers only 8% of real damage.
Investment ROI breaks down clearly. A $200K annual observability platform plus $100K chaos engineering tools plus 2 SRE FTEs at $300K totals $600K investment. This prevents a single major incident ($500K impact) plus improves deployment velocity. Reducing MTTR by 50% saves 20 engineering hours per incident times 30 incidents per year equals $120K annual savings.
Risk quantification provides another angle. Industry average is 2-3 major incidents per year. Multiply probability by average incident cost to get expected annual loss. Resilience investments should be 20-30% of expected loss.
Competitive positioning works too. Highlight competitor outages and customer expectations for 99.99%+ uptime. Regulatory requirements are tightening—EU and UK operational resilience regulations increasingly mandate chaos testing and multi-cloud strategies for services deemed important.
FAQ Section
What is the difference between chaos engineering and traditional disaster recovery testing?
Chaos engineering tests systems continuously in production or production-like environments with real traffic, discovering unexpected failure modes. Traditional disaster recovery testing occurs quarterly or annually, validates known recovery procedures in isolated test environments, but misses production-specific issues like unexpected dependencies, traffic patterns, and cascading failures.
How long does it take to implement chaos engineering organisation-wide?
Most organisations achieve basic chaos engineering capability within 3-4 months: month 1 for observability foundation, month 2 for staging experiments, month 3 for limited production experiments, month 4 for expanding blast radius. Reaching continuous chaos with automated Game Days typically requires 9-12 months of maturity building.
Can small engineering teams practice chaos engineering without dedicated SRE resources?
Yes. Small teams can start with lightweight chaos engineering using open-source tools like Chaos Monkey or cloud-native options (AWS Fault Injection Simulator, Azure Chaos Studio). Begin with simple experiments during business hours with manual oversight. As chaos maturity grows and value is demonstrated, justify dedicated SRE hiring to scale the practice.
What metrics should I track to measure observability effectiveness?
Key observability metrics include MTTR (target 50%+ reduction year-over-year), detection time (time from failure to alert), diagnostic time (alert to root cause identified), alert accuracy (percentage of alerts requiring action versus false positives), and observability coverage (percentage of services with metrics, logs, and traces instrumented).
How do I choose between Datadog, New Relic, and Honeycomb for observability?
Datadog offers comprehensive multi-cloud monitoring with strong infrastructure and application coverage, best for enterprises needing unified dashboards across AWS, Azure, and GCP. Honeycomb excels at high-cardinality event analysis for complex debugging, ideal for microservices-heavy architectures. New Relic provides robust APM with good cost-performance ratio for smaller teams. Consider 30-day trials with production data to evaluate query performance and team usability.
Should I implement chaos engineering before or after multi-cloud migration?
Implement chaos engineering before multi-cloud migration to understand current failure modes and validate single-cloud resilience. Use chaos experiments to identify dependencies that complicate multi-cloud adoption. This de-risks migration by ensuring you understand system behaviour thoroughly. Continue chaos testing during and after migration to validate multi-cloud resilience claims.
What are the most common mistakes when starting chaos engineering?
Common mistakes include starting in production without staging practice, running experiments without adequate observability, not defining clear experiment hypotheses, failing to communicate experiments to on-call teams, choosing blast radius too large for initial experiments, skipping manual safety oversight, treating chaos as one-time project rather than continuous practice, and not documenting learnings in runbooks.
How do I prevent chaos engineering experiments from triggering actual incidents?
Safety mechanisms include blast radius limits (affect less than 1% of traffic initially), automatic shutdown triggers (stop experiment if error rate increases 5%+), scheduled experiments during low-traffic periods, manual approval for high-risk experiments, circuit breakers to prevent cascading failures, and maintaining incident commander oversight during experiments with authority to halt immediately.
What is the relationship between chaos engineering and error budgets?
Error budgets (acceptable downtime allocated for innovation and risk-taking) determine when you can run chaos experiments. If you’ve consumed 80% of quarterly error budget, pause chaos testing until budget resets. Chaos engineering helps protect error budget by discovering issues in controlled conditions rather than through customer-facing incidents that rapidly consume budget.
Can chaos engineering work with legacy monolithic applications?
Yes, but requires adaptation. Start with infrastructure-level chaos (terminate instances, inject network latency, simulate region failures) rather than application-level fault injection. Use blue-green deployments to validate resilience improvements. Focus chaos experiments on known fragile areas (database connections, external API dependencies, session management). Legacy modernisation efforts should prioritise observability instrumentation to enable chaos testing.
How do I coordinate chaos experiments across multiple teams in a microservices environment?
Establish a central chaos engineering guild or SRE team that coordinates experiments, maintains a shared chaos calendar, defines safety standards, and provides tooling and training. Each service team owns chaos experiments for their services but follows organisation-wide safety protocols. Use ChatOps (Slack or Teams integration) to announce experiments, tag affected teams, and share real-time results. Conduct quarterly organisation-wide Game Days to practice coordinated incident response.
What should be included in a chaos engineering Game Day scenario?
Effective Game Day scenarios simulate realistic multi-component failures: combination of region outage plus database failover plus external API degradation. Include communication challenges (notification delays, missing stakeholders), time pressure (escalating customer impact), and decision points (trade-offs between recovery speed and data consistency). Validate runbooks, test escalation procedures, practice customer communication, and measure response effectiveness. Debrief immediately after to capture learnings while fresh.
Building operational resilience through chaos engineering and observability transforms how organisations handle infrastructure failures. By proactively discovering failure modes, implementing comprehensive observability, and practising incident response, you reduce MTTR, eliminate single points of failure, and build confidence in system resilience. The practices outlined in this guide—from dependency mapping to progressive deployment to Game Day exercises—provide a roadmap for achieving resilience beyond what cloud provider SLAs promise.
For more comprehensive guidance on infrastructure resilience, see our infrastructure reliability practices overview.