
Big Tech Valuations Explained: Understanding Trillion Dollar Market Caps and AI Investment Dynamics
Nvidia hit $5 trillion in October 2025. Apple and Microsoft each exceed Japan’s entire GDP. The Magnificent Seven now represent over one-third of the S&P 500—double the concentration during the 2000 dot-com bubble. These numbers shape the technology landscape you operate in, from infrastructure costs to investment decisions. This resource breaks down what’s driving these valuations, where the money flows, and what the 95% failure rate in AI returns means for your strategic planning. Use the guides below to navigate specific decisions around AI infrastructure spending, ROI measurement frameworks, and bubble risk assessment.
What is market capitalisation and how is it calculated?
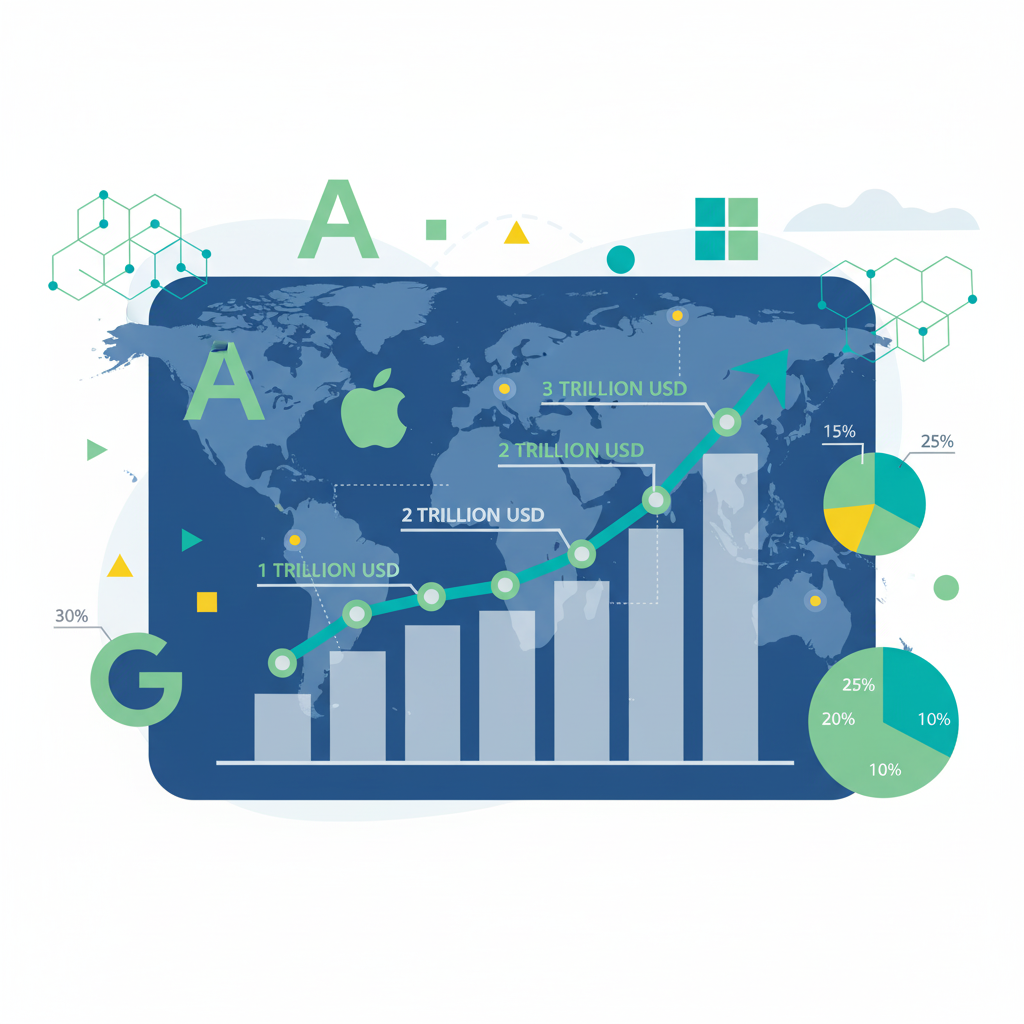
Market capitalisation measures a company’s total value as determined by the stock market. The calculation is straightforward: multiply the current share price by the total number of outstanding shares. If a company has 10 billion shares trading at $500 each, its market cap is $5 trillion.
This metric shapes index weightings, influences institutional investment decisions, and serves as shorthand for company size. When Nvidia reached $5 trillion in October 2025, it joined a category previously occupied only by nation-states. Apple became the first company to reach $1 trillion in 2018, and Nvidia became the first to breach $4 trillion in July 2025. Understanding how these valuations compare to national economies puts your vendor relationships and market exposure in perspective.
What are the Magnificent Seven and why do they matter?
The Magnificent Seven comprises Apple, Microsoft, Nvidia, Alphabet, Amazon, Meta, and Tesla—the dominant technology companies driving market returns and setting infrastructure standards. As of Q3 2025, Nvidia leads at $4,542 billion, followed by Microsoft at $3,850 billion and Apple at $3,794 billion.
Their concentration affects your team in two ways. First, these companies represent over one-third of the S&P 500, meaning your retirement funds and corporate investments are heavily exposed to their performance. Second, they control the platforms, cloud services, and AI infrastructure you likely depend on. When Meta increases AI spending or Microsoft adjusts Azure pricing, it directly affects your operational costs and strategic options.
But their dominance extends beyond market share—their capital expenditure decisions shape what resources are available to everyone else. Understanding the trillion dollar valuation milestone journey reveals why this concentration matters for your technology decisions.
How much are Big Tech companies spending on AI?
The numbers are substantial. Microsoft, Alphabet, Amazon, and Meta plan over $300 billion in combined capital expenditure for 2025, primarily directed at AI infrastructure. Gartner estimates global data centre spending will reach $475 billion in 2025—a 42% increase. McKinsey projects $5.2 trillion in cumulative data centre investment will be needed by 2030 to meet AI demand.
This spending shapes your options. It determines GPU availability, cloud service pricing, and which AI capabilities reach the market. Understanding where this money actually goes—cloud platforms, GPUs, data centres—helps you anticipate supply constraints and pricing trends that affect your own infrastructure decisions. The breakdown also reveals how different company strategies approach AI infrastructure investment differently.
Why are 95% of organisations seeing zero returns on AI investment?
An MIT study found that while 95% of AI pilots fail to deliver measurable returns, the remaining 5% achieve sustained value at deployment. The gap stems from misaligned expectations: teams expect ROI within 7-12 months, but successful implementations typically require 2-4 years.
Common failure patterns include starting with technology rather than business problems, underestimating data quality requirements, and lacking clear success metrics before deployment. The companies succeeding with AI treat it as a capability-building exercise rather than a quick fix. They invest in data infrastructure, establish governance frameworks, and set realistic timeframes. Our practical ROI frameworks guide details approaches to measuring returns and avoiding the pilot trap. This challenge also explains why evaluating bubble risk remains critical for timing AI infrastructure commitments.
Is AI investment a bubble or sustainable transformation?
The honest answer: it shows characteristics of both. Warning signs include circular financing patterns—Nvidia investing in OpenAI while OpenAI purchases Nvidia chips—and enterprise adoption lagging significantly behind consumer enthusiasm. Goldman Sachs‘ CEO has warned publicly about “capital deployed that doesn’t deliver returns.”
However, unlike the dot-com era, today’s tech giants generate substantial cash flows and have established revenue models. The question isn’t whether AI creates value—it does in specific applications—but whether current valuations accurately price the horizon and magnitude of that value creation. Our detailed bubble analysis examines the parallels and differences with previous technology cycles, while our ROI measurement approaches help you evaluate whether specific investments make sense regardless of broader market conditions.
How do Big Tech valuations compare to national GDPs?
Nvidia’s $5 trillion valuation exceeds every national GDP except the United States and China. Apple and Microsoft, each at approximately $4 trillion, exceed Japan’s GDP. This concentration of economic power in private entities has no parallel in modern history.
For your team, this comparison contextualises the forces affecting your technology decisions. When a single company’s valuation exceeds major economies, their strategic choices ripple through supply chains, talent markets, and regulatory frameworks globally. The detailed breakdown of how these valuations reached this level reveals the specific drivers you should monitor. This unprecedented scale also raises questions about market sustainability that affect your long-term planning.
What is driving these unprecedented valuations?
Four primary factors explain current valuations. First, AI investment expectations—markets price in massive future returns from artificial intelligence capabilities. Second, cloud computing provides predictable recurring revenue that investors value highly. Third, network effects and ecosystem lock-in create defensible market positions. Fourth, the rise of passive investing concentrates capital into index leaders.
The concentration creates its own momentum: as these companies grow, they attract more index investment, which increases their prices and attracts more investment. This self-reinforcing cycle explains why the Magnificent Seven’s S&P 500 weighting has doubled since the 2000 bubble peak. Understanding the cloud platform and GPU investment breakdown shows how these drivers translate into actual infrastructure spending that shapes your vendor options.
Which AI investment strategies are succeeding?
Three strategies show clear results. Microsoft’s Azure AI services achieved 40% growth by embedding AI capabilities into existing enterprise relationships—customers adopted AI tools within platforms they already used. Nvidia captured 90% of the AI chip market and secured $500 billion in orders through 2026 by focusing on developer ecosystem and CUDA software lock-in. Samsung‘s AI Megafactory with 50,000+ GPUs demonstrates the vertical integration strategy—controlling the hardware to reduce dependency on others.
The detailed comparison of Magnificent Seven strategies examines what’s working and what’s failing across different approaches, with lessons applicable to your own strategic choices. These case studies complement our practical ROI measurement frameworks by showing how leading organisations actually achieve returns on AI investments.
How should you approach AI infrastructure decisions?
Start with the data: 85% of companies increased AI investment in the past 12 months. For generative AI, 15% report significant ROI already, with 38% expecting returns within one year. Agentic AI shows longer horizons—only 10% see significant ROI currently, with most expecting results in 1-5 years.
These adoption patterns should inform your infrastructure choices. Quick wins exist in generative AI applications with clear use cases and available data. More ambitious agentic AI projects require longer investment horizons and different success metrics. The practical frameworks in our ROI measurement guide help you set appropriate expectations and track the right metrics for each category. To make informed vendor decisions, also review where AI infrastructure spending actually flows across cloud platforms and chip manufacturers.
The articles below provide deeper analysis of each topic covered above. Use them to explore specific areas relevant to your current decisions.
Big Tech Valuations Resource Library
Understanding Scale and Context
How Nvidia Apple and Microsoft Reached Trillion Dollar Valuations That Exceed National GDPs Deep dive into the specific mechanisms driving tech valuations beyond national economies, including the role of AI expectations and market concentration.
Investment and ROI Analysis
Where Big Tech AI Spending Goes: Cloud Platforms GPUs and Data Centre Investment Breakdown Track the $300 billion in planned 2025 capex and understand how infrastructure spending affects your costs and options.
Measuring AI Investment Returns: Practical ROI Frameworks When 95 Percent of Organisations See Zero Returns Actionable frameworks for measuring AI returns, avoiding common failure patterns, and setting realistic timeframes.
Risk and Strategy Assessment
AI Investment Bubble or Sustainable Boom: Warning Signs Dot Com Parallels and Risk Mitigation Objective analysis of bubble indicators, differences from previous cycles, and risk mitigation approaches for your team.

Magnificent Seven AI Strategies Compared: Meta Samsung Nvidia and Lessons From Winners and Losers Strategy breakdown of major tech companies’ AI approaches with applicable lessons for your own investment decisions.
Frequently Asked Questions
How much is Nvidia worth today?
Nvidia’s market capitalisation fluctuates with trading but reached $5 trillion in early 2025, making it briefly the world’s most valuable company. This valuation exceeds the GDP of every country except the United States and China. For current figures, financial data providers like Yahoo Finance and Bloomberg provide real-time tracking. For context on how this milestone was reached, see our analysis of trillion dollar valuations compared to national GDPs.
What does trillion-dollar company mean?
A trillion-dollar company has a market capitalisation exceeding $1 trillion (one thousand billion). This represents the total value investors assign to all company shares. Currently, only Apple, Microsoft, Nvidia, Alphabet, and Amazon consistently maintain trillion-dollar valuations.
Why is Nvidia stock so high?
Nvidia’s valuation reflects its dominant position supplying GPUs essential for AI training and inference. As AI investment accelerates across Big Tech, Nvidia captures significant revenue as the primary supplier of required computing hardware. The company’s CUDA software platform creates additional competitive moat. Learn more about Nvidia’s strategy in our Magnificent Seven AI strategy comparison.
Is there an AI bubble in tech stocks?
Evidence exists for both bubble conditions (circular financing, infrastructure overbuilding, enterprise adoption lagging hype) and sustainable transformation (genuine productivity improvements, revenue growth, fundamental capability advances). For detailed analysis of warning signs and risk mitigation, see our Bubble Risk Assessment.
When will we see real returns from AI investments?
ROI timelines vary by AI type. Generative AI often delivers productivity gains within months. Agentic AI requires longer transformation periods, sometimes 12-18 months. Only 5% of organisations currently report measurable returns, making ROI measurement frameworks essential. See our ROI Frameworks guide for practical implementation.
Which cloud provider is best for AI workloads?
AWS, Azure, and Google Cloud each have strengths for different AI use cases. Azure integrates well with Microsoft enterprise tools, AWS offers broadest service range, and Google Cloud provides strong ML infrastructure. For detailed comparison, see our AI Infrastructure Spending breakdown.