


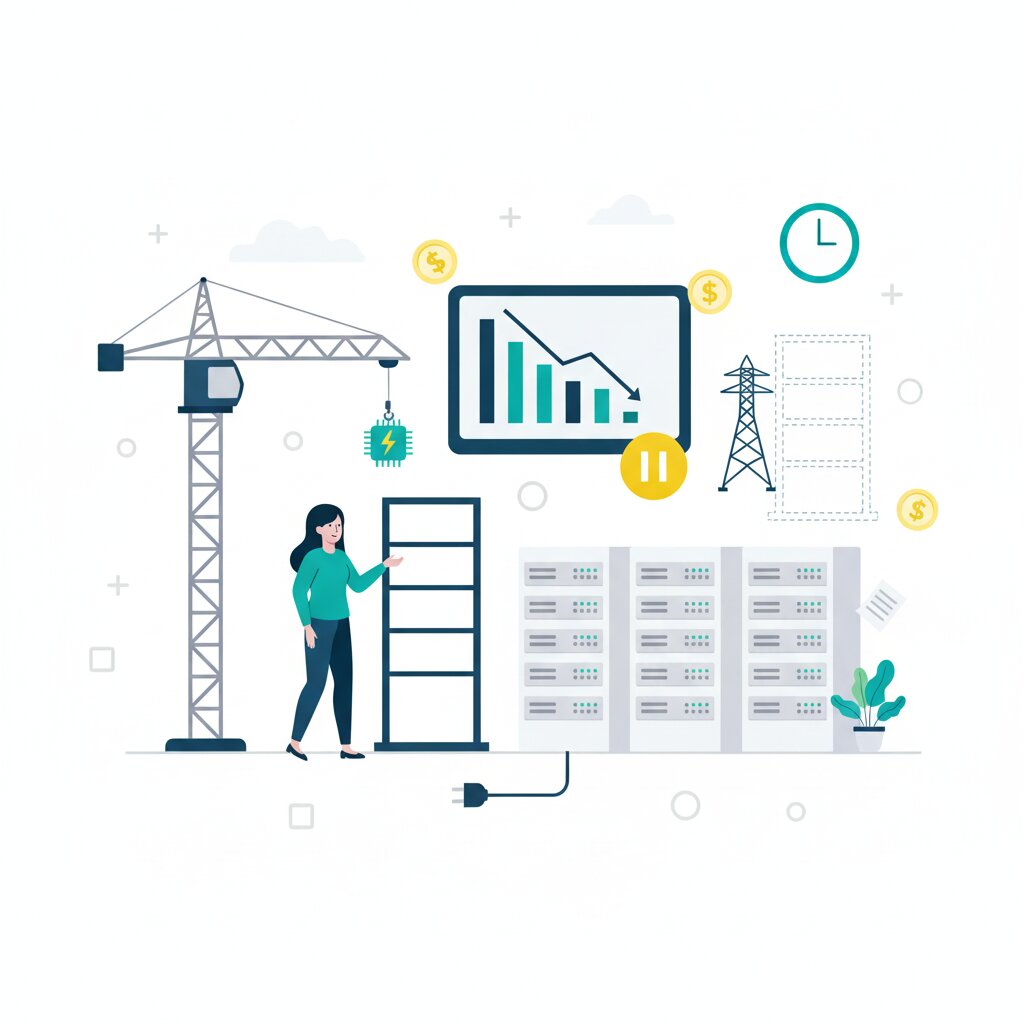

Two things are true at once. Alphabet, Amazon, Meta and Microsoft are committing about $650 billion to AI capacity in 2026, and 30-50% of the capacity planned for 2026 is being delayed or cancelled. NVIDIA’s data centre revenue has climbed from $1 billion a quarter in 2019 to $51 billion in late 2025, and Google Cloud’s backlog tops $460 billion. The money and the chips are ready; the constraint sits in the physical and regulatory chain. We walk through the headline figure, the seven-year timeline, the power required, and why Northern Virginia saturates first, as part of our look at the boom’s growing collateral damage.
Why is 30-50% of US AI data centre capacity planned for 2026 facing delays or cancellation despite record investment?
The binding constraints are power and approvals. Goldman Sachs Research tallies roughly $650 billion committed for 2026, while Sightline Climate and Currence put 30-50% of planned 2026 capacity at risk of delay or cancellation: about 5 GW under construction against roughly 12 GW planned.
The demand side confirms it: Amazon, Alphabet and Meta have raised capex guidance, and Microsoft added nearly 1 GW of capacity in one quarter. GPU orders and cloud backlogs keep climbing too, confirming the shortfall is physical and regulatory.
The headline mixes delays and cancellations. A slide keeps the project alive, like the STACK Infrastructure and Oracle Stargate campus in New Mexico, pushed to 2029 by permitting fights. A stop kills it: Microsoft reportedly cancelled about 200 MW of AI data centre leases, and Satya Nadella says “there will be an overbuild”.
Much of the “cancelled” capacity was announcement-stage: phantom projects with no site control and no power. Goldman Sachs Research’s adjusted materialisation benchmark of roughly 60% of next-year capacity and 50% two years out is a better planning number.
Moratoriums add outright cancellations: New York froze new permits for data centres over 50 MW in July 2026, and more states are drafting measures as moratorium legislation spreads across US states.
For your planning: tight capacity feeds into cloud and colocation pricing.
Why do AI data centre projects take seven-plus years to energise when the building goes up in 12-18 months?
The building is the fast part. A shell goes up in 12 to 18 months; the power connection owns the schedule: permitting and approvals, interconnection studies averaging 40 months in PJM against an 8-11 month target, transformer and switchgear procurement, then commissioning.
Projects entering service in 2025 averaged more than seven years to reach operational status: three years to an interconnection agreement, then four more. The national queue holds over 2.2 TW, and conversion is poor: only 24% of PJM’s 2020 cohort reached agreement or operation. PJM publishes its queue data on pjm.com, where you can pull the current numbers yourself.
Equipment is a hard gate even with a queue position. High-voltage transformer lead times stretched from 24-30 months before 2020 to as long as five years, and a single tap-changer bushing quotes at three to five years. More in transformer and equipment lead times.
No single party owns the end-to-end timeline; each stage is optimised separately and delays compound. Carnegie Endowment research values a year of delay for a 100 MW facility at more than $500 million over its life cycle. Behind-the-meter generation can cut a year off the timeline, so operators are buying turbines, but turbine lead times of two to three years cap that route too.
How much electricity do AI data centres consume today, and how much will they need by 2030?
The demand these queues and lead times must serve keeps growing. US data centres drew 31 GW in 2025, and Goldman Sachs Research projects 41 GW in 2026 and 66 GW by 2027, up from 4.1% to 8.5% of US peak summer demand. Globally, the IEA’s Energy and AI report sees consumption roughly doubling from 415 TWh in 2024 to about 945 TWh by 2030.
945 TWh is roughly Japan’s current annual electricity use, near 3% of world electricity, and grid construction cannot match that pace. A single campus draws hundreds of megawatts to 1 GW-plus, the load of a small city: xAI’s Colossus runs about 460 MW of gas turbines, and Stargate Abilene runs roughly 100,000 NVIDIA GB200 systems.
Rack density is what pushes campus loads up: the industry has climbed from 10-15 kW cloud racks toward 100 kW-plus AI racks, which is why liquid cooling is replacing air. Direct-to-chip is the default today, immersion the high-density edge.
Efficiency won’t rescue the grid. Cheaper per-token compute raises total usage rather than caps it, the classic Jevons paradox, and Google says it is compute constrained in the near term even as its PUE keeps improving. That is how the buildout’s pressures connect.
Why is Northern Virginia’s grid saturated while other regions are still courting data centres?
Northern Virginia won the first wave on dense fibre, low latency and tax incentives, and now hosts over 4,900 MW of operating capacity with more than 5,000 MW planned. Dominion Energy needs about 27 GW of new generation by 2039, while interconnection backlogs, land scarcity and local politics slow energisation.
Other states court the overflow with spare power, land and incentives, for now. Blackouts remain unlikely, even as safety margins shrink.
An estimated 70% of global internet traffic passes through the region, and Virginia’s tax exemption was worth $928 million in FY23. Virginia imports roughly a third of its electricity, so it leans on neighbouring states that are facing their own demand growth.
PJM’s reserve margin sits near 18.9% and could fall toward 8% by 2028 in a low-new-entry scenario, so local margins tighten before systems fail. One 2024 incident shows how that plays out: a Fairfax County cluster dropped about 1.5 GW in minutes and the system held. Your bills depend on rate design: under Virginia’s GS-5 tariff, large loads pay at least 60% of generation and 85% of transmission and distribution capacity costs.
ERCOT interconnects projects in two to three years, and Texas may overtake Virginia by 2030. But saturation travels with demand. Ireland’s data centres reached about 21% of national electricity, and Dublin stopped accepting new connections until 2028, while Frankfurt is having similar debates.
The money and the demand were always there; the grid, the equipment and the approvals were the binding limits, and none of them clear quickly, so slippage will persist. Headline delay percentages will keep shifting as announced and under-construction denominators change; energisation will keep lagging the money. The squeeze lands downstream in capacity availability and pricing, which is what the squeeze means for your tech budgets. For the wider picture, see the full collateral damage map.
Frequently Asked Questions
Is the 30 to 50% delay figure accurate?
It is directionally useful but not precise. The range comes from Goldman Sachs Research and rests on facility-level data (about 5 GW under construction against roughly 12 GW planned), yet it lumps together projects at very different stages. Much “cancelled” capacity was announcement-stage only: “phantom” projects without site control or power agreements. SemiAnalysis disputes the headline’s denominator, and materialisation rates (near 60% of next-year capacity, about 50% two years out) give a truer read.
Do these grid constraints affect all data centre projects, or only AI campuses?
AI campuses dominate the headline numbers because a single site can draw hundreds of megawatts to 1 GW-plus, but the constraints apply to any large new load. Interconnection queues, transformer lead times and permitting slow conventional colocation and enterprise builds too. The difference is scale and urgency: as AI absorbs available capacity, other projects feel the same squeeze on supply and cost.
How much power does a single hyperscale AI campus draw, and why can it strain a local grid like a small city?
A single hyperscale AI campus typically draws hundreds of megawatts, and the largest reach or exceed 1 GW, roughly the load of a small city. xAI’s Colossus runs about 460 MW of gas turbines, and Stargate Abilene has reached roughly 100,000 GB200 systems. That concentrated, single-customer demand can overwhelm local substations and trigger years of generation, transmission and interconnection work before it energises.
What’s the difference between a delayed data centre project and a cancelled one?
A delay keeps the project alive but pushes its energisation date out, such as the STACK Infrastructure and Oracle campus in New Mexico, pushed to 2029. A cancellation stops it, though “cancelled” often means a paused lease or a shelved site rather than a finished asset being scrapped, as with Microsoft’s lease-pause reporting. Both count in the headline figure, but they mean very different things for capacity planning.
Are AI data centres going to cause blackouts or higher electricity bills?

System-wide blackouts are unlikely. PJM’s reserve margin sits near 18.9% and could fall toward 8% by 2028 in a low-new-entry scenario, so the risk is tightening local safety margins rather than grid failure. Bill impacts depend on rate design and who funds upgrades: under Virginia’s GS-5 tariff, large loads pay at least 60% of generation and 85% of transmission-and-distribution capacity costs during ramp-up.
Will the capacity squeeze push up cloud and colocation prices for tech buyers?
Yes. When energisation lags demand, available megawatts and rack space command a premium, which feeds through to colocation rates and cloud capacity costs. The effect is gradual rather than sudden, because much capacity is contracted years ahead, but buyers planning 2027 and 2028 workloads should expect less flexibility and firmer prices. That squeeze is where the delay lands for the wider tech economy.
If AI chips keep getting more efficient, won’t that reduce data centre power demand?
Not in aggregate. Efficiency lowers the cost per token, which raises usage rather than capping it, so total consumption keeps climbing even as PUE and per-chip performance improve. Google and NVIDIA both report major efficiency gains while data centre energy use rises, the pattern known as the Jevons paradox. Treat efficiency as a partial offset to demand growth, not a solution to it.
What is behind-the-meter generation, and can it really cut a data centre’s time to power?
Behind-the-meter generation means power produced on site, outside the utility’s interconnection queue, usually by gas turbines. It can cut a year or more from time to energisation, which is why operators are buying turbines. The catch: equipment lead times cap how many projects can take that route, so it eases timelines for some rather than clearing the queue for everyone.
Will these delays ease soon, or should we expect slippage to keep compounding?
Expect slippage to persist, because the causes are structural: interconnection queues, equipment lead times and permitting do not clear in a quarter. One honest caveat: headline delay rates will keep shifting as announced and under-construction denominators change, so treat any single percentage cautiously. What is not in doubt is that energisation keeps lagging the money, and the squeeze flows to capacity availability and pricing.
Direct-to-chip versus immersion cooling: which approach wins for AI rack densities?
Direct-to-chip liquid cooling is the practical default for most AI deployments today: it supports 100 kW-plus racks, fits existing server designs and ships at scale with platforms like NVIDIA’s GB200 systems. Immersion cooling offers higher density and efficiency potential but requires new tank infrastructure and operational change. Expect direct-to-chip to lead near-term, with immersion growing at the high-density edge.
Where can I find PJM’s interconnection queue data and construction delay statistics?
PJM publishes its interconnection queue data on its website at pjm.com, where active requests can be filtered by state, capacity and fuel type, along with study milestones and withdrawal rates. Its queue reports and planning documents also show current study durations and completion rates; only 24% of PJM’s 2020 cohort reached agreement or operation, and the average wait of roughly 40 months still far exceeds FERC’s 8 to 11 month target.
Where can I download the IEA’s “Energy and AI” report with global data centre electricity projections?
The IEA’s “Energy and AI” report is free to download from the IEA website at iea.org, along with its datasets and scenario tables. Its central projection has data centre electricity consumption roughly doubling from about 415 TWh in 2024 to about 945 TWh by 2030, near 3% of global electricity. It remains the reference dataset for global demand forecasts.